Somewhere in your organisation right now there is a deck with engagement scores on it. It has a red cell or two, a slide titled Key Themes, and an action plan that will be presented once and never mentioned again. Meanwhile the people who filled in that survey are quietly deciding whether it was worth twenty minutes of their time. Most of them will conclude it was not, and next year your response rate will drop, and someone will suggest the survey tool is the problem.
It is not the survey tool. Indian companies have become genuinely good at measuring engagement. What almost nobody has built is the muscle for what happens in the ninety days after the results land. That gap is where engagement programmes quietly die, and in 2026 the cost of letting them die has gone up sharply.
The numbers Indian HR leaders are working with in 2026
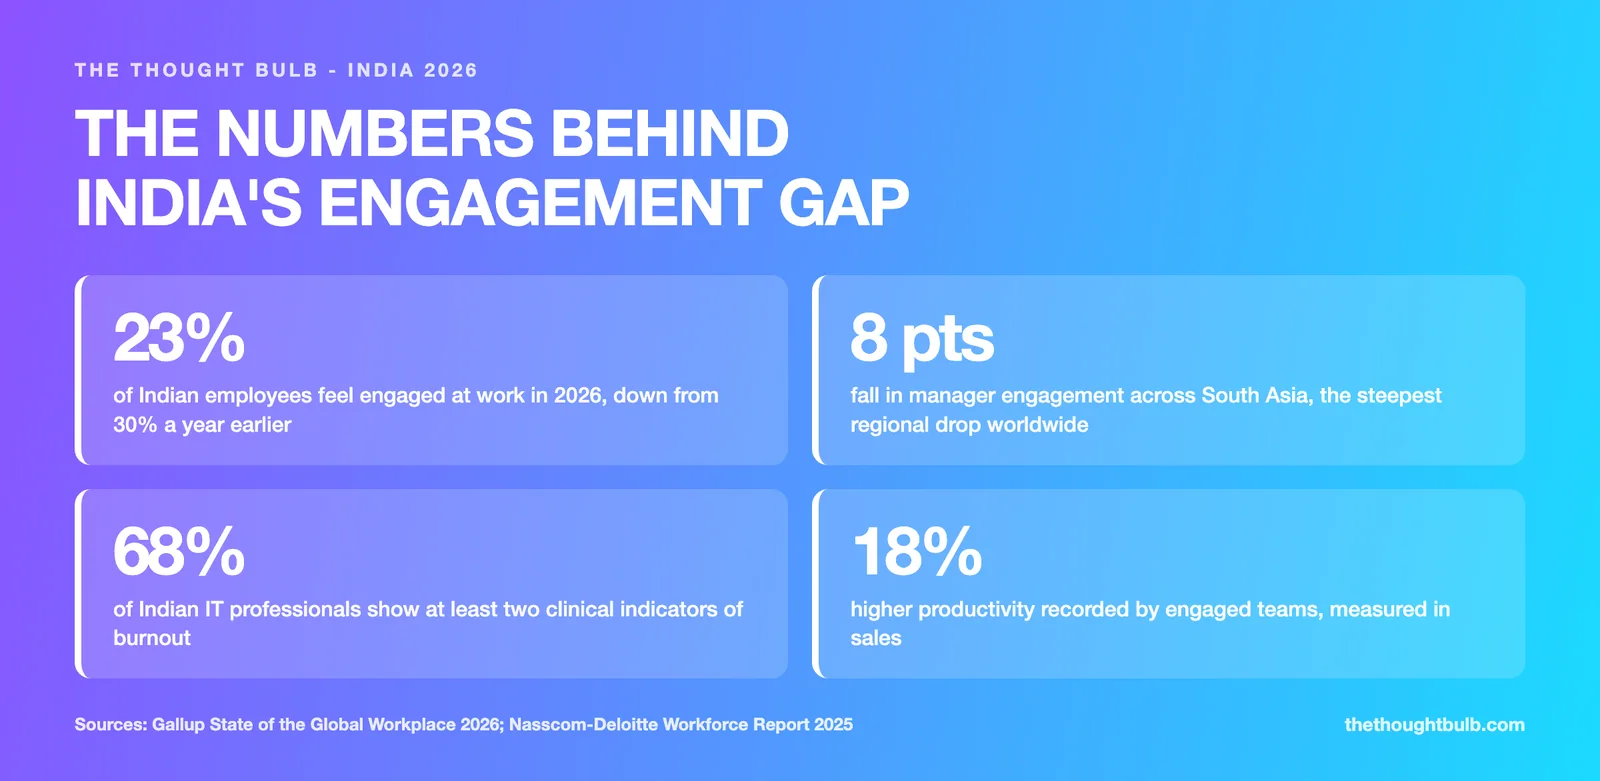
Gallup's State of the Global Workplace 2026 put engagement among Indian employees at 23 percent, down from 30 percent the year before. That is still ahead of the global figure of roughly 20 percent, but the direction is what matters. A seven point fall in a single year is not noise, and it lands on top of a workforce that was already stretched.
Two other findings from the same period sharpen the picture. Manager engagement across South Asia, which is predominantly India, fell eight points in one year, the steepest regional decline recorded anywhere. And the 2025 Nasscom-Deloitte workforce report found that 68 percent of Indian IT professionals show at least two clinical indicators of burnout. Set against Gallup's finding that engaged teams record 18 percent higher productivity measured in sales, the commercial argument stops being abstract.
23 percent of Indian employees say they feel engaged at work in 2026, down from 30 percent a year earlier
Manager engagement in South Asia fell 8 points in a single year, the steepest regional drop worldwide
68 percent of Indian IT professionals show at least two clinical indicators of burnout
Engaged teams record 18 percent higher productivity, measured in sales
Low engagement costs the global economy roughly 9 percent of GDP
The manager number is the one to sit with. Managers are the people expected to run the post-survey conversation with their teams. If they are the group disengaging fastest, then handing them a results deck and an action-planning template is asking the most depleted layer of the organisation to fix everyone else.
Why survey results stop moving between the dashboard and the floor
Having sat in a lot of these debriefs, the failure is rarely a lack of intent. It is four specific habits that feel responsible in the room and read as silence to everyone outside it.
The results get sanded down before anyone sees them
Scores travel up to leadership, get discussed, and come back as a summary with the sharp edges removed. Employees who wrote blunt comments see a polite paraphrase and learn that honesty gets laundered. The next round of comments will be shorter and safer, which makes the data worse, which makes the whole exercise less useful.
The action plan is company-wide when the problem is not
A single organisation-level initiative gets announced because it is easier to report on. But engagement is local. A sales pod in Gurugram struggling with recognition and a product team in Bengaluru struggling with workload do not share a problem, and a shared solution will fail both of them. Aggregate scores hide exactly the variation you need to act on.
Nothing is ever taken off the list
Most survey responses in India are, underneath the wording, about capacity. People are asking for less, not more. Responding with additional initiatives, more meetings, and a new recognition portal confirms that nobody read the actual message. If your action plan only adds things, you have misread the data.
There is no visible follow-up
This is the big one. The strongest predictor of survey cynicism is running a survey without visible follow-up. It is not whether you solved the problem. It is whether people could see you trying. Organisations that act on results show measurable gains in satisfaction over time, and organisations that do not show close to none, which means an unactioned survey is worse than no survey at all. It spends trust and returns nothing.
A 90 day sequence from results to real change
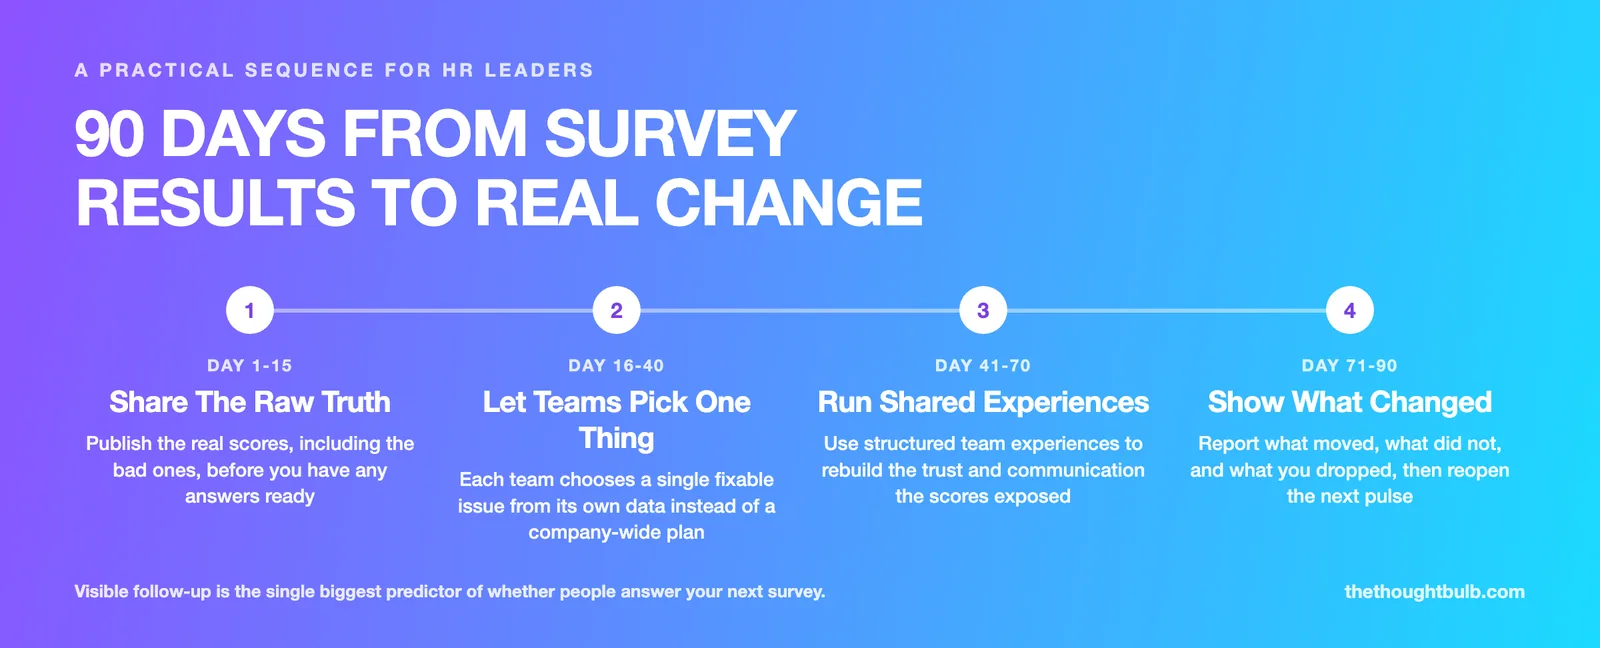
The structure below works because it front-loads honesty and ends with a public reckoning. It fits the quarter, which is usually all the runway you get before the next business cycle pulls attention away.
Day 1 to 15, share the raw truth. Publish the real scores, including the ones that embarrass you, before you have any answers ready. Saying we do not yet know what to do about this is far stronger than a polished plan that arrives six weeks late.
Day 16 to 40, let every team pick one thing. Give each manager their own team's data and ask for a single fixable issue, chosen by the team, not assigned from the centre. One real change beats five announced ones.
Day 41 to 70, run shared experiences. Most survey themes come down to trust, communication and cross-team friction, and those do not improve through policy documents. They improve when people work on something together that is not their day job.
Day 71 to 90, show what changed. Report what moved, what did not move, and what you deliberately dropped and why. Then open the next pulse. Naming what you chose not to do is what makes the rest credible.
The fourth stage is the one organisations skip, and it is the one that buys you a usable response rate next year. Reporting honestly on a failed initiative earns more credibility than quietly replacing it with a new one.
Where structured team experiences actually help
Day 41 to 70 is the stage where most plans go vague. The themes surveys surface in Indian organisations are consistently relational: teams that do not understand what other teams do, managers people cannot read, and colleagues who have worked together for two years over video without ever having an unstructured conversation. You cannot memo your way out of any of those.
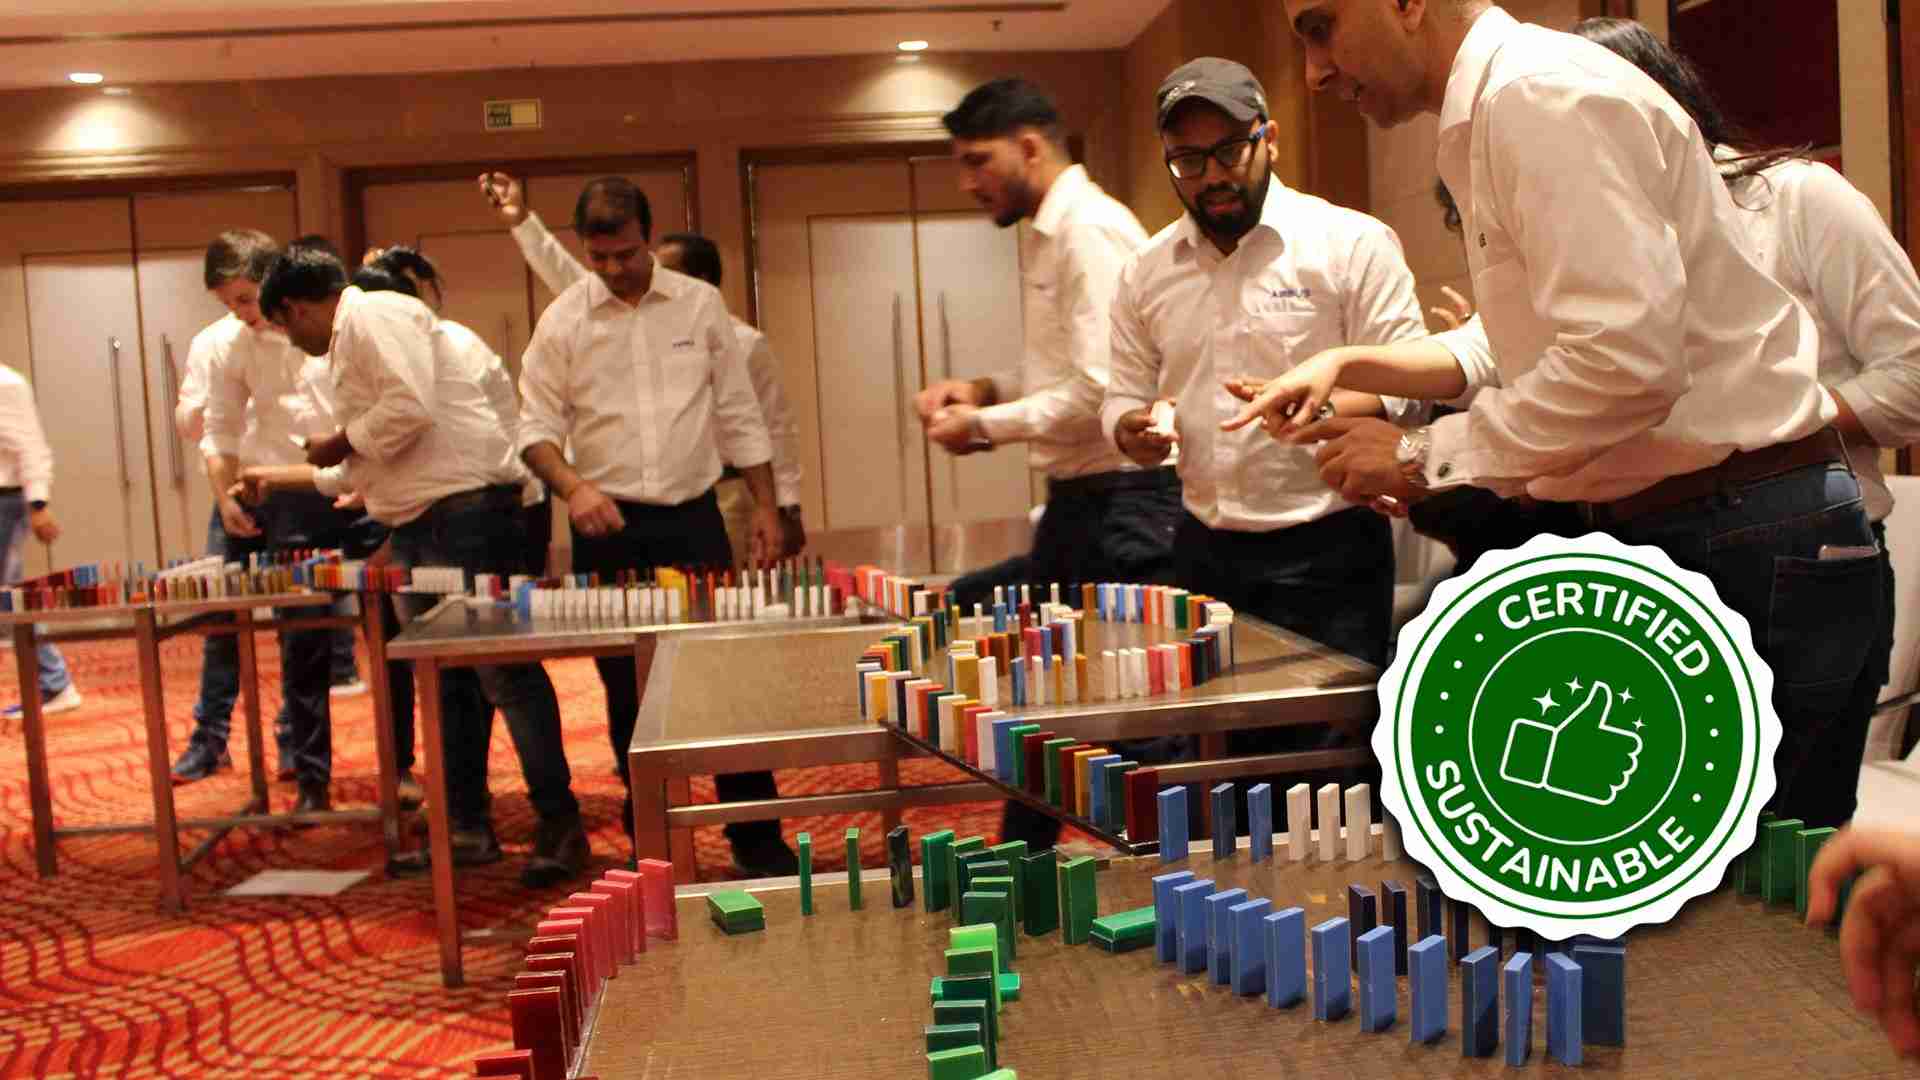
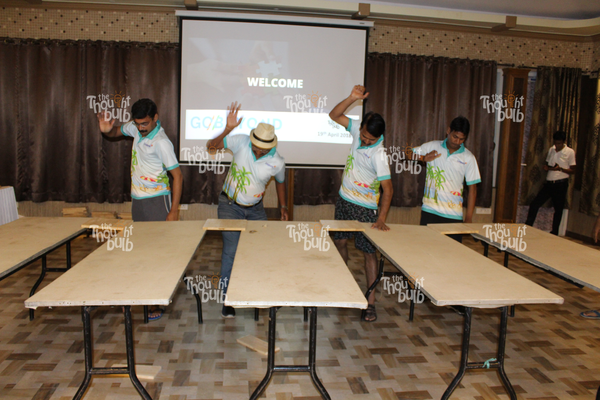
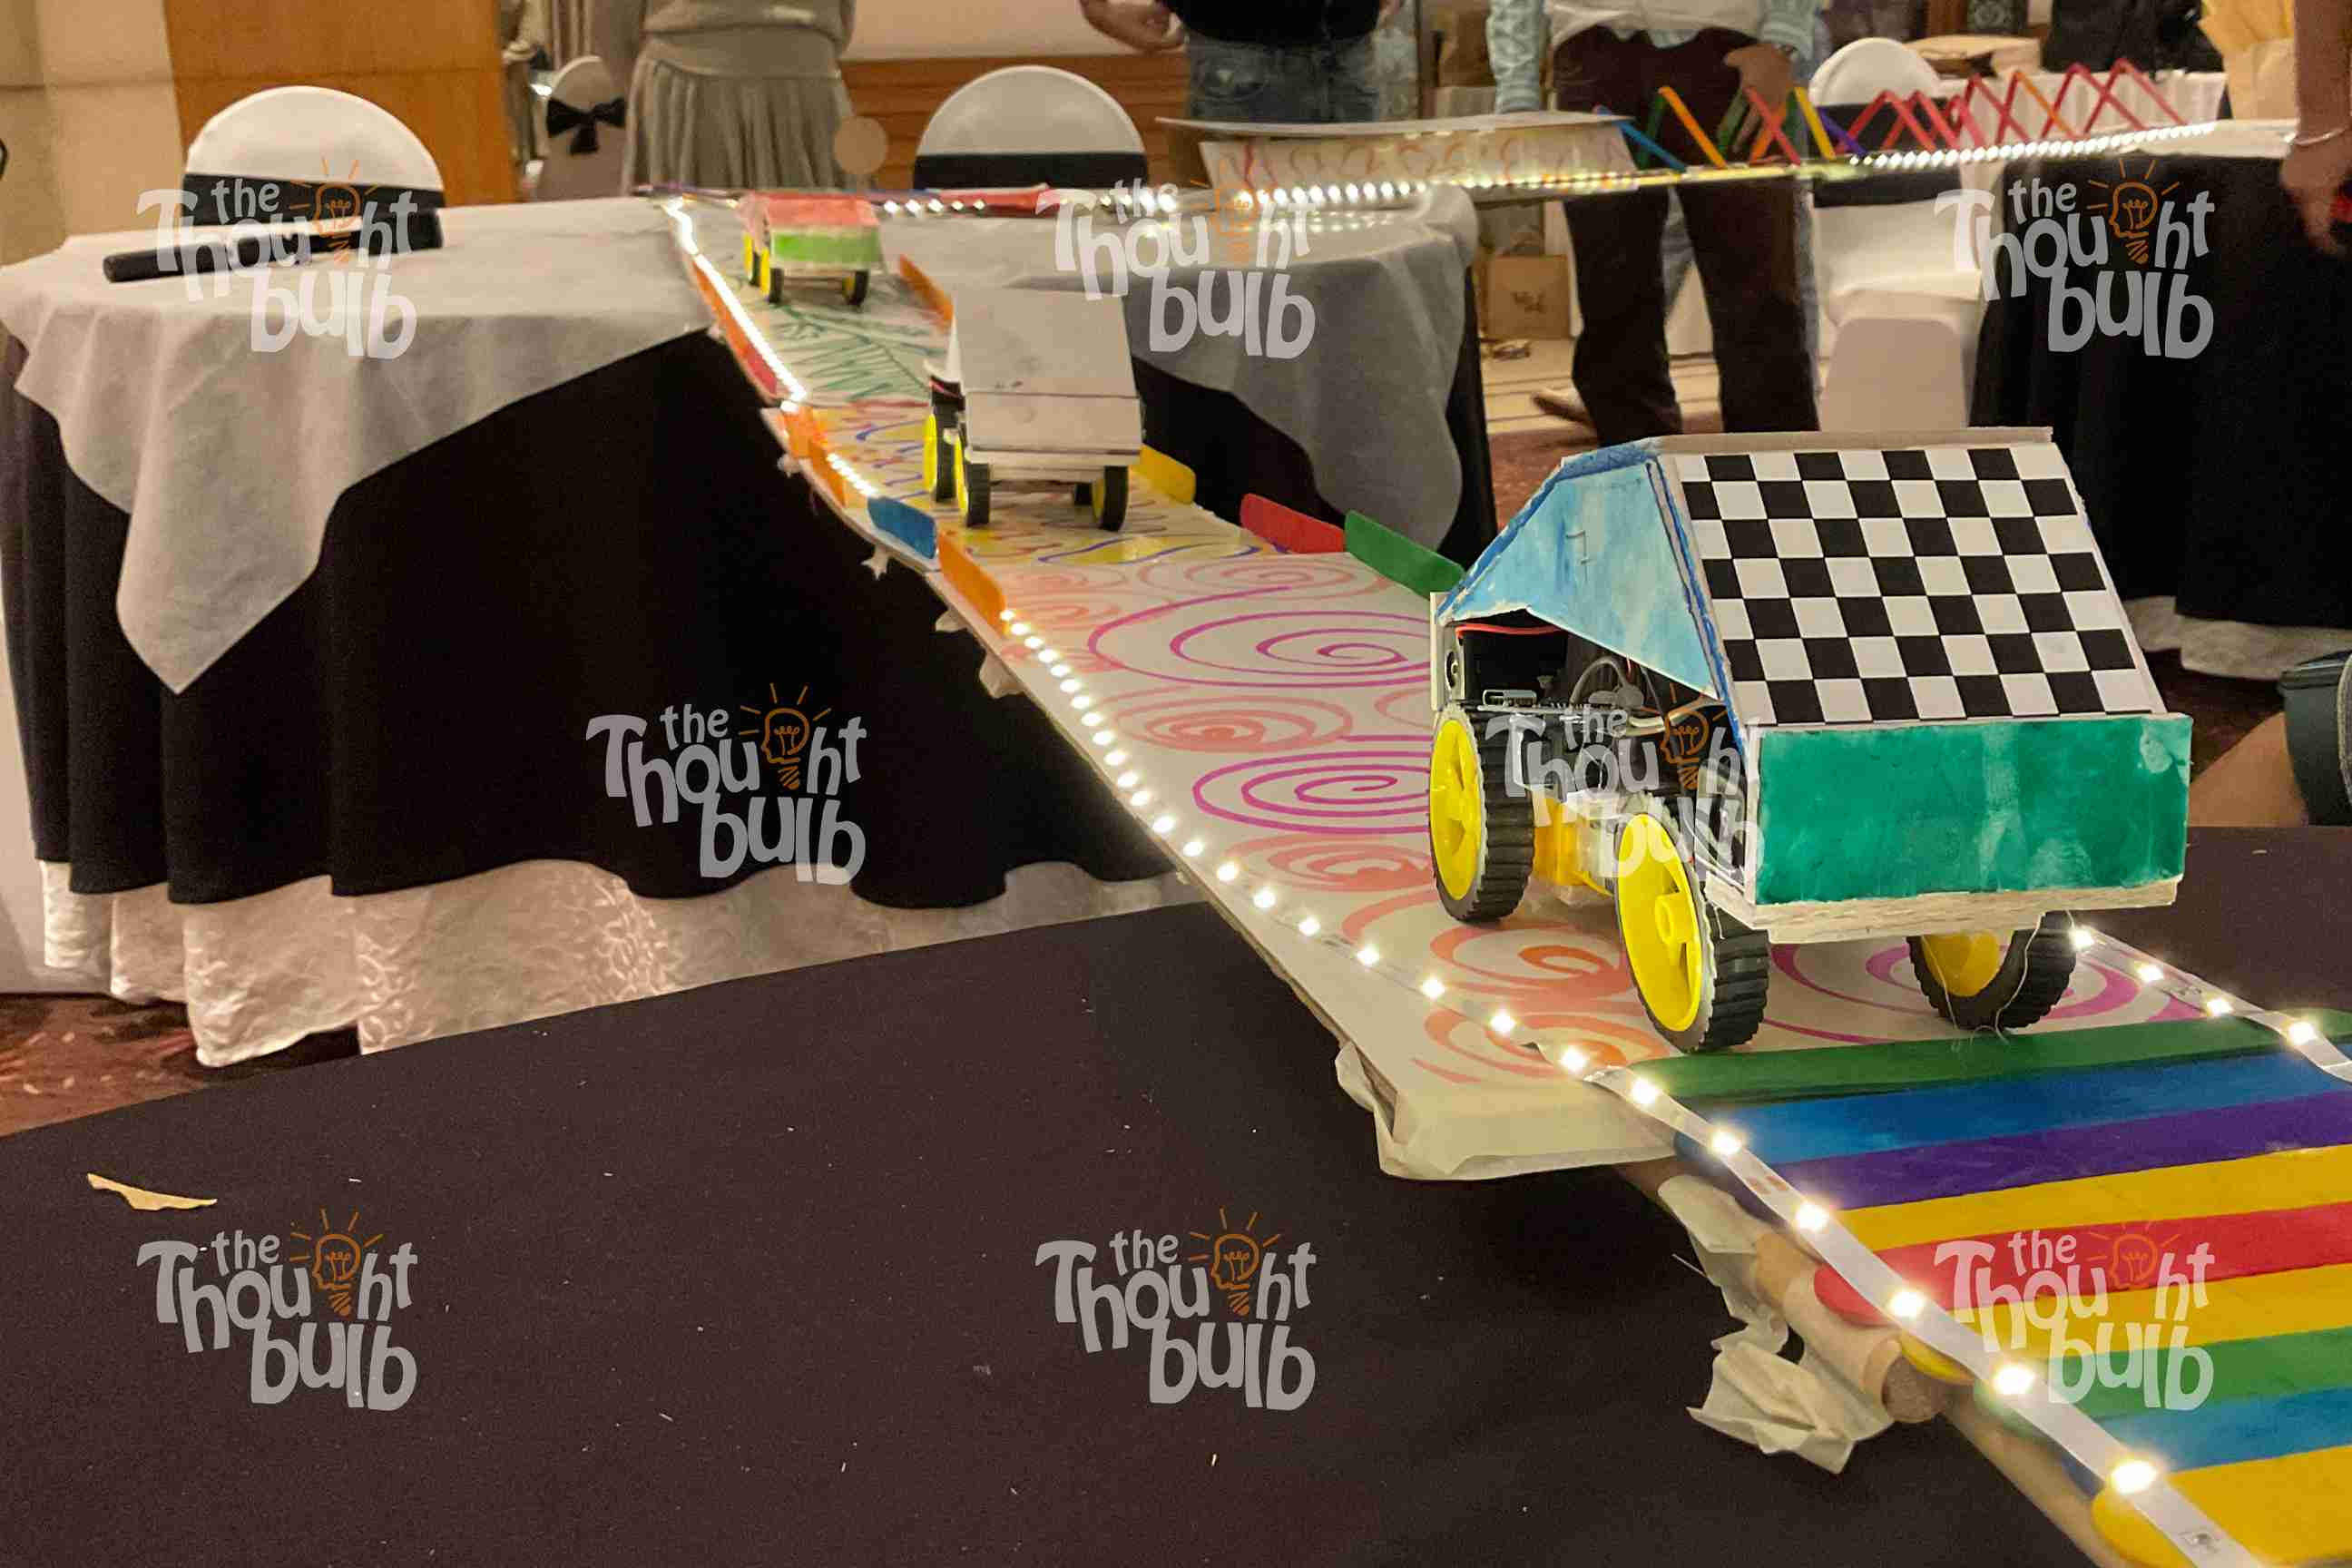
For cross-team friction, which is the most common theme we are asked about, a structured collaboration challenge does the diagnostic work for you. Bridge The Gap puts sub-teams to work building halves of a structure that must ultimately connect, without full visibility of each other's plans. Within about twenty minutes, the group re-enacts whatever its real coordination problem is, in miniature and without anyone's job on the line. The debrief afterwards tends to be far more candid than any follow-up focus group, because people are discussing something they just watched themselves do.
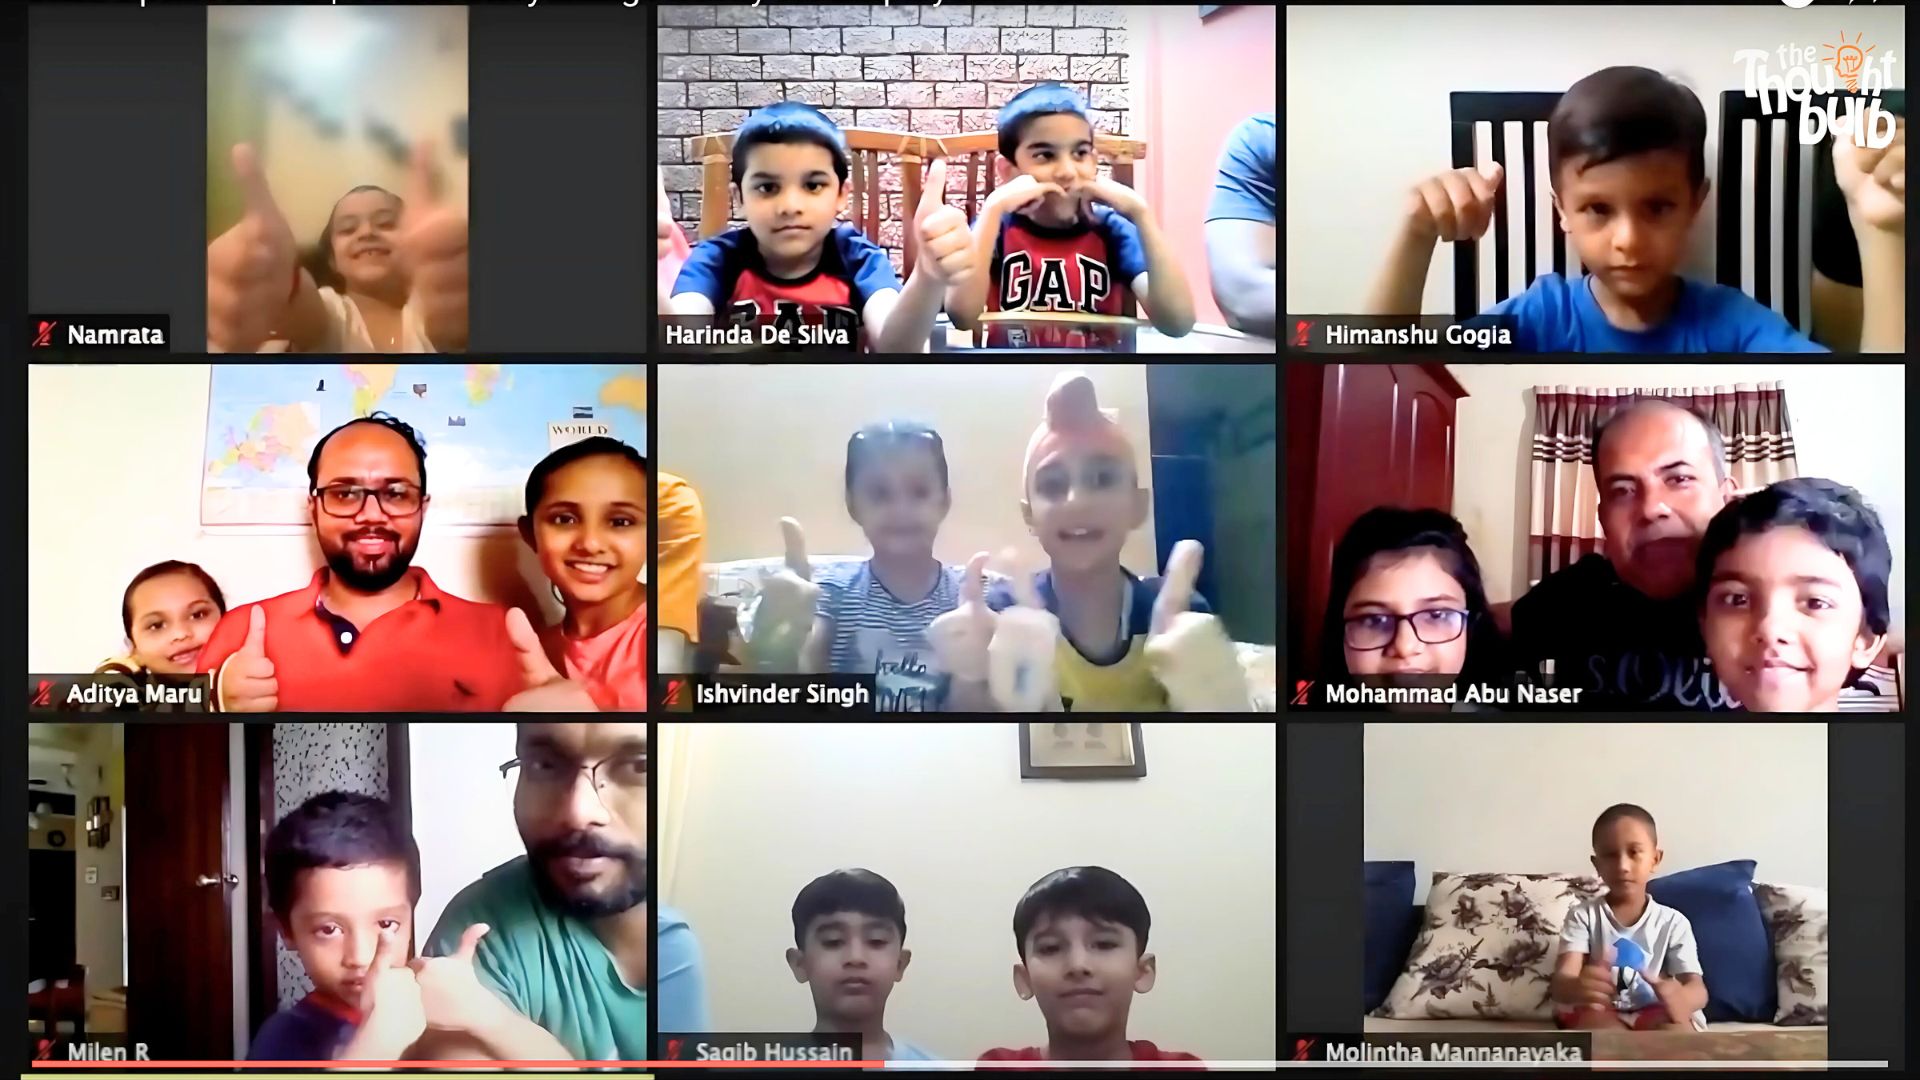
Where the survey theme is about voice, recognition or people not feeling heard, and especially where the team is distributed across cities, a virtual storytelling session does work that a town hall cannot. Once Upon A Time has colleagues build and tell a shared story, which sounds light until you notice it forces equal airtime in a group where a few voices normally dominate. For hybrid teams whose scores flagged inclusion or communication, that redistribution of airtime is the intervention.
Which experience fits depends entirely on what your data actually said, and the mistake is picking the activity first and the reason second. It is worth browsing the full range of team building activities against your own survey themes rather than defaulting to whatever the team did last year.
What this looked like at Siemens
Siemens ran Bridge The Gap with a team in Mumbai for exactly this reason. The brief was not morale in the abstract. It was that groups who depended on each other daily were working from different assumptions about what the other side needed and when.
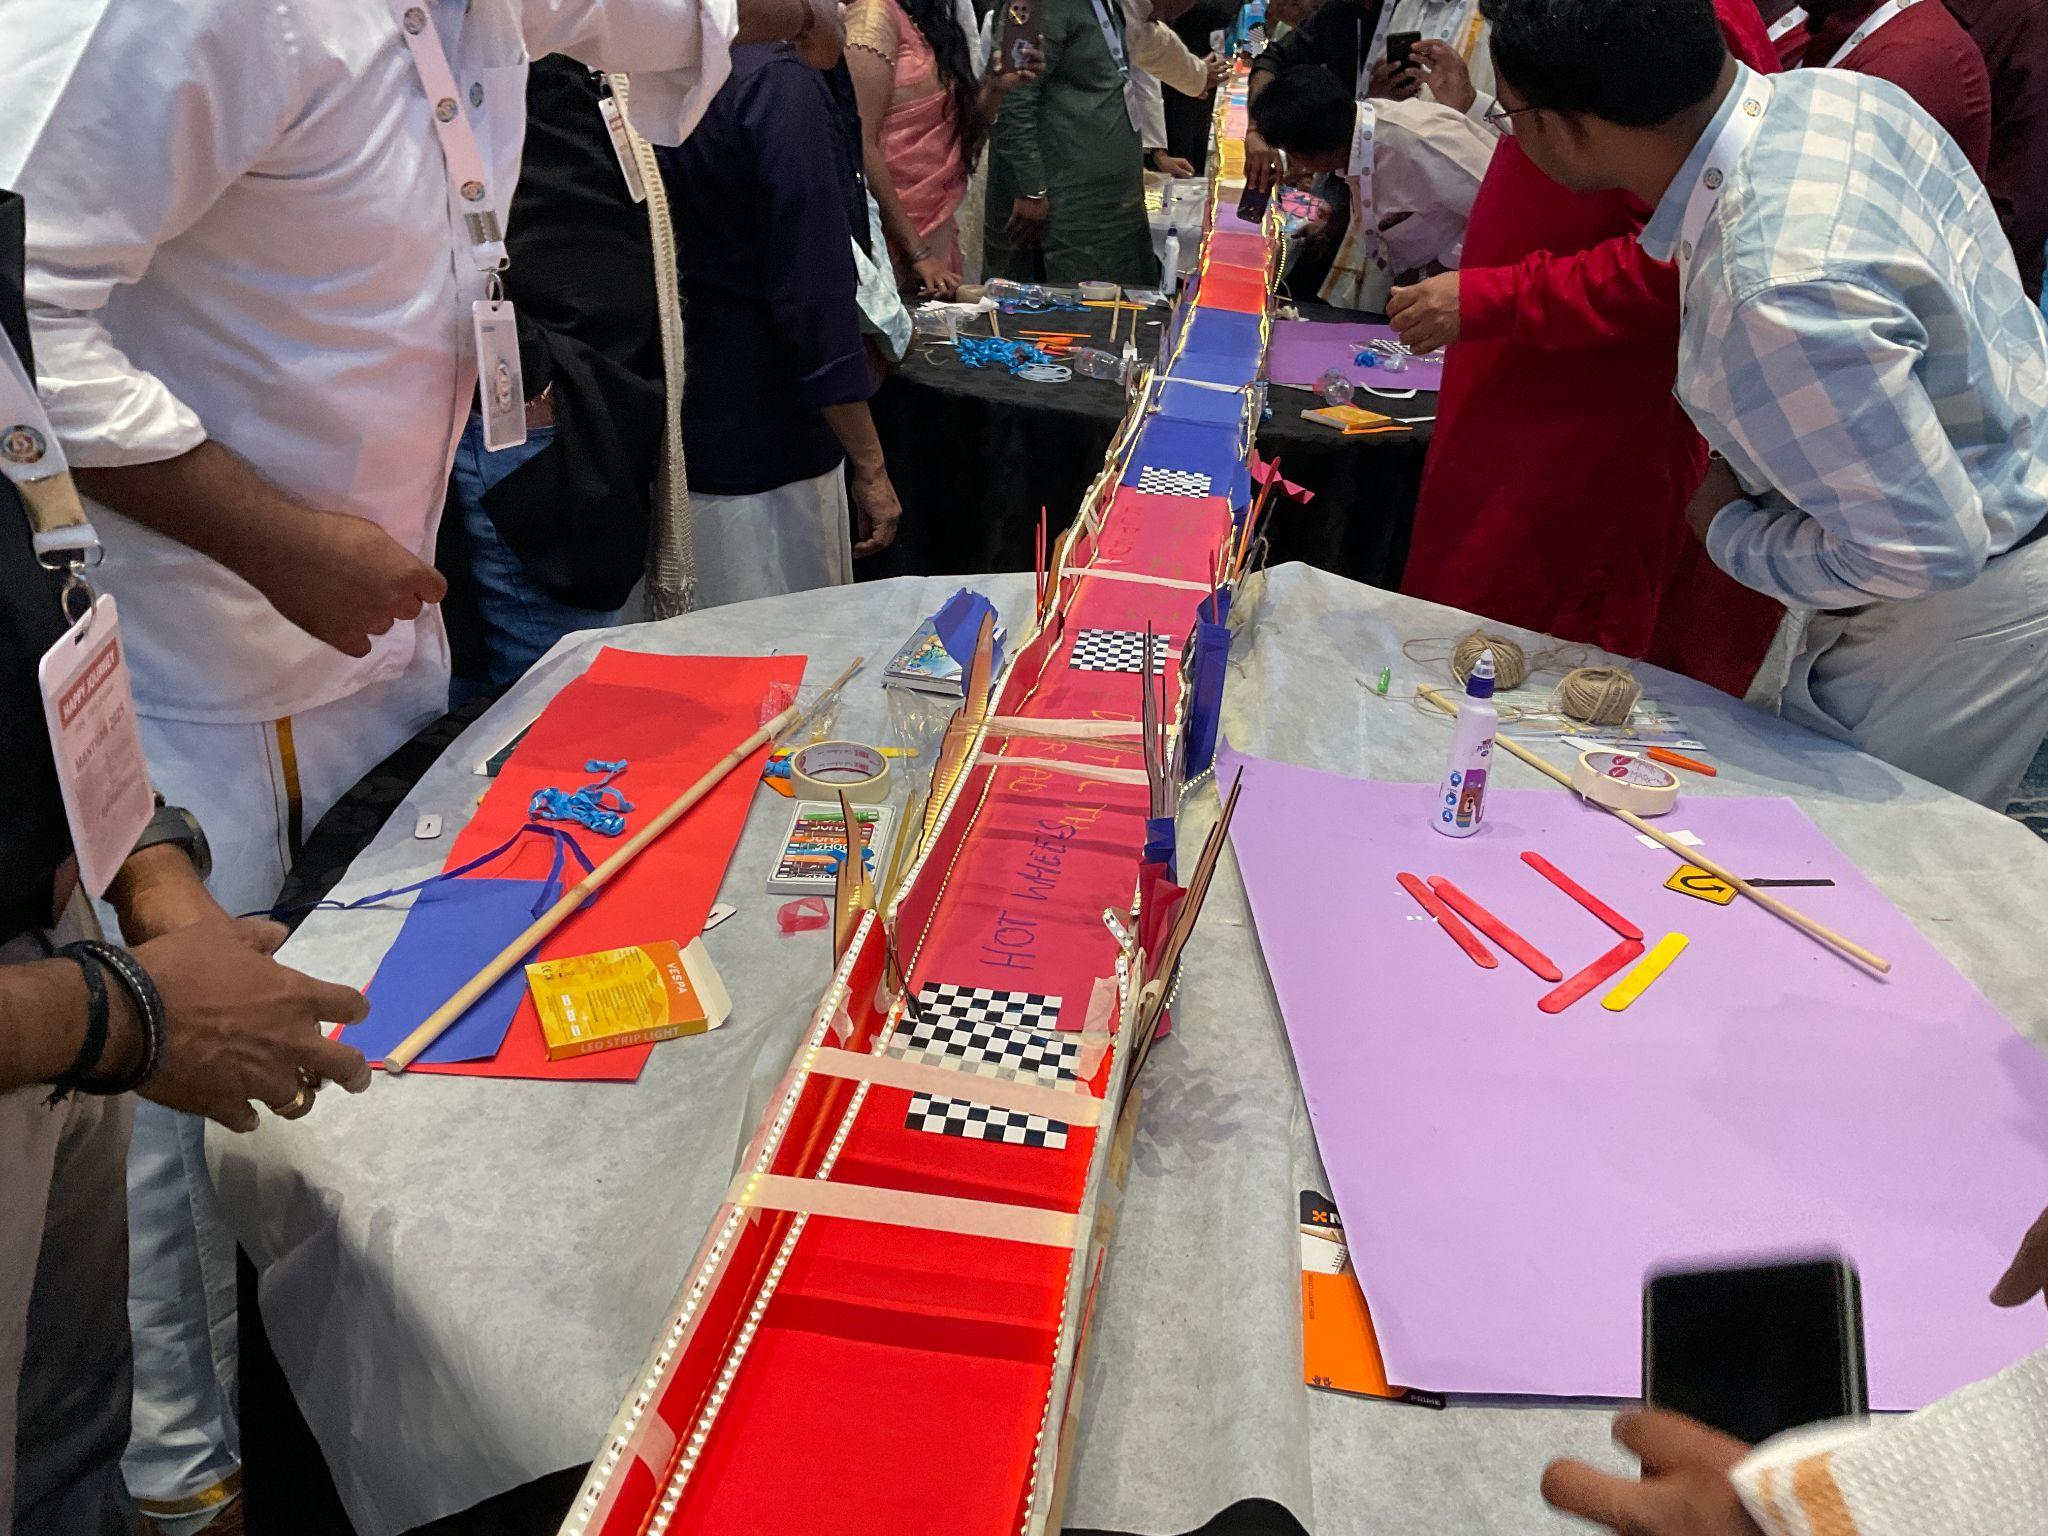
The activity split participants into units building separate sections of a bridge that had to meet in the middle, with deliberately incomplete information about the other side's design. What surfaced during the build was the same pattern the teams described in their working week: assumptions never checked, updates shared late, and both groups confident they had communicated clearly. Because it happened in a session rather than on a live deliverable, people could name it without anyone getting defensive. The debrief gave the team concrete language for a problem that had previously only shown up as a low score on a collaboration question.
Patterns like this repeat across sectors far more than most HR teams expect, and reading through other client case studies is a quick way to see which interventions matched which underlying problem.
Build the calendar before the next survey, not after
The organisations that get value from engagement surveys tend to have one structural advantage: they decided what their year of engagement looks like before the results arrived. When the survey lands, they are adjusting an existing rhythm rather than inventing a response from nothing under time pressure.
That is the argument for planning the year in advance rather than reacting quarter by quarter. An employee engagement calendar gives you something to flex when the data comes in, which is a very different position from an empty quarter and a red cell on a slide.
The short version
Your engagement survey is almost certainly fine. The scores are probably accurate, and at 23 percent engagement nationally, a difficult result is closer to the norm than the exception. What decides whether the exercise was worth running is the ninety days that follow: whether you published the real numbers, whether teams chose their own fix, whether you created situations in which people actually worked together differently, and whether you came back and said plainly what changed.
Do that once and your next survey gets better data, because people will believe answering it does something. Skip it and you will spend next year debating survey vendors while the actual problem goes untouched. If you are staring at a set of results right now and are unsure which of your themes needs a conversation and which needs a genuinely different shared experience, that is a question worth talking through before you commit the budget.